
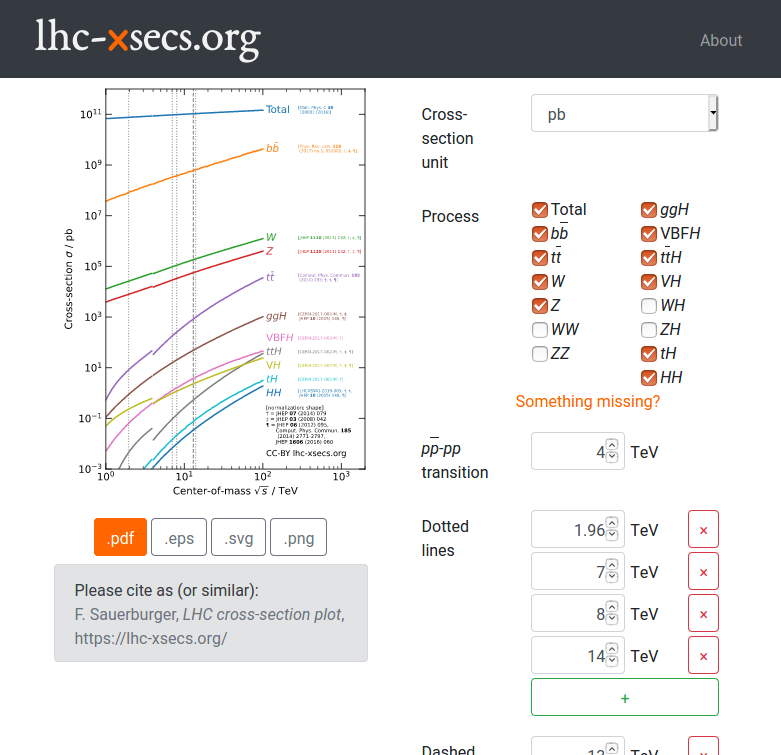
A couple of months ago, I’ve strung together a small web app to create a customizable plot showing which particle-physical reactions happen at the LHC at which rate.
The heart of the app is a
flask-powered API using matplotlib to crate the plot on-demand. It’s not trivial to
run matplotlib in a multi-threaded environment.
This stackoverflow post
suggests that it’s possible if you don’t rely on the pyplot API and rely
instead on Figure() directly.
from matplotlib.backends.backend_agg import FigureCanvasAgg as FigureCanvas
from matplotlib.figure import Figure

@app.route('/xsecs.png')
def plot():
    fig = Figure(figsize=(4.5, 6))
    ax = fig.subplots()

    # do something with ax

    with io.BytesIO() as pseudo_file:
        FigureCanvas(fig).print_png(pseudo_file)
        content = pseudo_file.getvalue()

    return Response(content, mimetype="image/png")
Alternatively or additionally, it is possible to instruct uwsgi to run in
multiprocess-mode with single-threaded processes.
The plot creation can be rather slow. It is a good idea to add a caching layer, for example in nginx, to prevent unnecessary plotting and provide often-used-plots without any time delay.
A sample nginx configuration could look as follows.
uwsgi_cache_path /tmp/webcache levels=1:2 keys_zone=my_cache:10m max_size=1g
             inactive=48h use_temp_path=off;
uwsgi_cache_key $request_uri;
uwsgi_cache_valid 200 48h;
uwsgi_cache_min_uses 1;

server {
    listen 80;
    location / { try_files $uri @api_location; }
    location @api_location {
        include uwsgi_params;
        uwsgi_cache my_cache;

        uwsgi_pass API_SERVER:3031;
    }
}
This might also interest you