Over the last months, I’ve developed two Python packages: atlasify and nnfwtbn. The former is a package which applies the ATLAS collaboration specific plotting style to matplotlib plots, while the latter is a framework to train neural network tailored for high-energy physics based on keras. Both frameworks have a special focus on plotting. While the demand and the code base of two projects grew rapidly, I ran into two independent issues with matplotlib. At first, I assumed there is an issue in the way I use matplotlib; however, it turned out to be a bug in matplotlib itself.
I’ve submitted a pull request for both issues. The current master version of matplotlib contains both fixes. This article briefly describes the first of these issues.
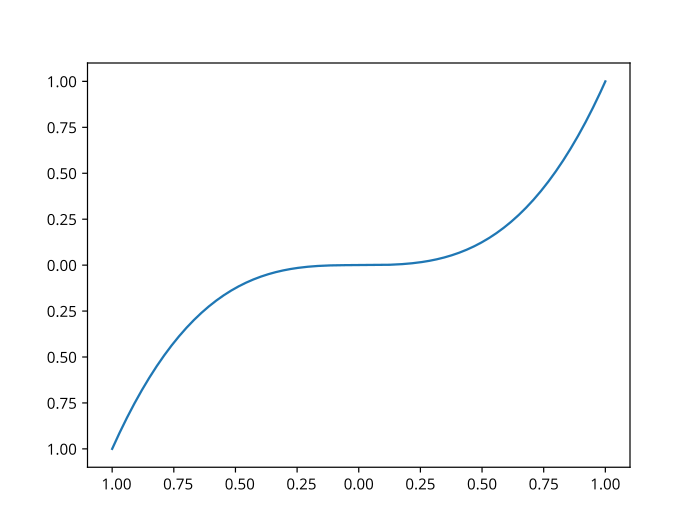
By default, matplotlib rightfully uses the Unicode minus glyph (−) instead of regular ASCII hyphens (-), which gives a typographically better result. I usually work on an Ubuntu machine. The ataslify package switches the font to Arial, and I typically save my plots in PDF format. During a meeting, while giving a presentation including recent plots, the Adobe reader refused to render any slide which contained a plot with a minus sign. This was weird and honestly quite annoying. At some point I realized that even with evince, the minus sign glyphs are missing. The issue seemed to be related to the minus signs.

A couple of hours using the Python debugger on my code and the matplotlib source code later, I noticed that PDF files created with matplotlib are corrupted under certain circumstances. They are corrupted if
- The plot contains characters whose code points are above 255, and
- These characters are rendered in a font whose TTF file is a symlink with a different name.
If you install Arial on Ubuntu, it will introduce a symbolic link named
arial.ttf pointing to Arial.ttf. In the PDF file, glyphs with a code point
below 256 are stored directly in the embedded font. All other glyphs are
stored as XObjects with a specific name. When these glyphs are placed on the
page, they are referenced by their names. The issues arose because the name was
not generated consistently. The glyph name contains the name of the TTF file.
When embedding the glyphs, the resolved file name is used. When referencing the
glyph, the name of the symlink was used.
The fix implements a consistent scheme which always resolves symlinks to build XObject names. The fix will be available in matplotlib 3.3.
This might also interest you
