
Over the last months, I’ve developed two Python packages: atlasify and nnfwtbn. The former is a package which applies the ATLAS collaboration specific plotting style to matplotlib plots, while the latter is a framework to train neural network tailored for high-energy physics based on keras. Both frameworks have a special focus on plotting. While the demand and the code base of two projects grew rapidly, I ran into two independent issues with matplotlib. At first, I assumed there is an issue in the way I use matplotlib; however, it turned out to be a bug in matplotlib itself.
I’ve submitted a pull request for both issues. The current master version of matplotlib contains both fixes. This article briefly describes the second of these issues and is part 2 of this series. The other bug was detailed in another article.
In high energy physics, the most common way to present data is in the form of a
histogram, especially stacked histograms. In many cases, the data is already
histogrammed, so I have to use the bottom and weights argument of matplotlib’s hist
method. Consider the following snippet.
import matplotlib.pyplot as plt

entries = [2, 3]

# Bin edges
bins = [0, 1, 2]

plt.hist(bins[:-1],
         bins=bins,
         bottom=[1, 2],  # Set lower edge
         weights=entries,
         histtype='stepfilled')

plt.savefig("example.png")
The usage might look a bit weird, but this is a convenient way to achieve this particular task. The output, however, looks as follows:
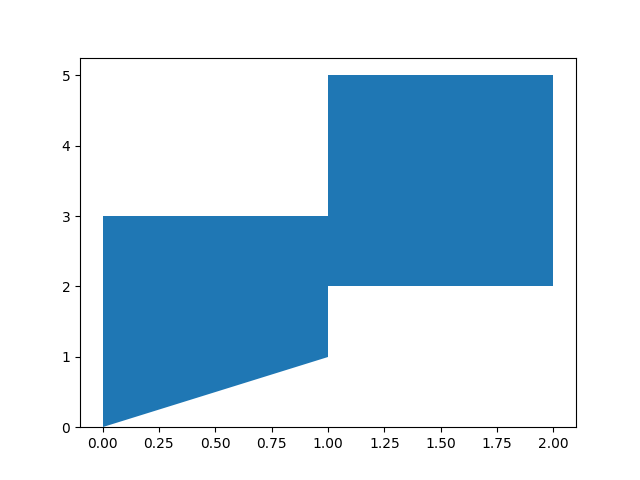
The first bin doesn’t look right. The bottom outline of the first bin should be horizontal and not be connected to the origin. As it turned out this was a bug in matplotlib. Version 3.3 will contain an updated version, which properly renders the histogram.
This might also interest you