
Sometimes, debugging state-of-the-art AI applications in an on-premise Kubernetes cluster requires capturing network packets and performing complex statistical traffic exploration and analysis. Traffic is easily captured with
sudo tcpdump -i any -s 65535 -w /tmp/capture.pcap
and decoded with Wireshark. However, complex analyses require other tools. Let’s open the data scientists’ toolbox: Polars.
Loading
The basic idea is to use Scapy to read the capture file, decode the packets and various protocols, and organize the data in a Polars dataframe. In this example, let’s extract the source and destination IP address, the packet length, and the query domain name from DNS packets.
import polars as pl
import matplotlib.pyplot as plt
import scapy.all as sa
from scapy.all import PcapReader
import seaborn as sns
from tqdm import tqdm

with PcapReader("capture.pcap") as reader:
    df = pl.DataFrame(
        (
            {
                "IP:src":     packet["IP"].src                    if "IP"  in packet else None,
                "IP:dst":     packet["IP"].dst                    if "IP"  in packet else None,
                "IP:len":     packet["IP"].len                    if "IP"  in packet else None,
                "DNS:qcode":  packet.sprintf("%DNS.opcode%")      if "DNS" in packet else None,
                "DNS:qnames": [x.qname for x in packet["DNS"].qd] if "DNS" in packet else [],
            }
            for packet in tqdm(reader)
        ),
        schema=pl.Schema({
            "IP:src": pl.String(),
            "IP:dst": pl.String(),
            "IP:len": pl.Int32(),
            "DNS:qcode": pl.String(),
            "DNS:qnames": pl.List(pl.String()),
        })
    )

# Derive additional columns
df = df.with_columns(
    internal=pl.col("IP:src").str.starts_with("10.") & pl.col("IP:dst").str.starts_with("10.")
)
Additionally, we can derive additional columns, such as whether the packet is internal or external, based on the IP addresses. A more robust analysis could include the packet’s IP addresses as 32-bit integers and applying bitwise operations to determine membership in a network subnet.
The resulting, redacted dataframe looks something like:
| IP:src | IP:dst | IP:len | DNS:opcode | DNS:qnames | internal |
|---|---|---|---|---|---|
| “10.x.x.x” | “10.x.x.x” | 128 | null | [] | true |
| “162.55.242.49” | “91.59.x.x” | 188 | null | [] | false |
| “10.x.x.x” | “10.x.x.x” | 93 | null | [] | true |
| “10.x.x.x” | “10.x.x.x” | 93 | null | [] | true |
| “10.x.x.x” | “10.x.x.x” | 843 | null | [] | true |
| “10.x.x.x” | “10.x.x.x” | 139 | “QUERY” | [“ns-2.sit-servers.net.”] | true |
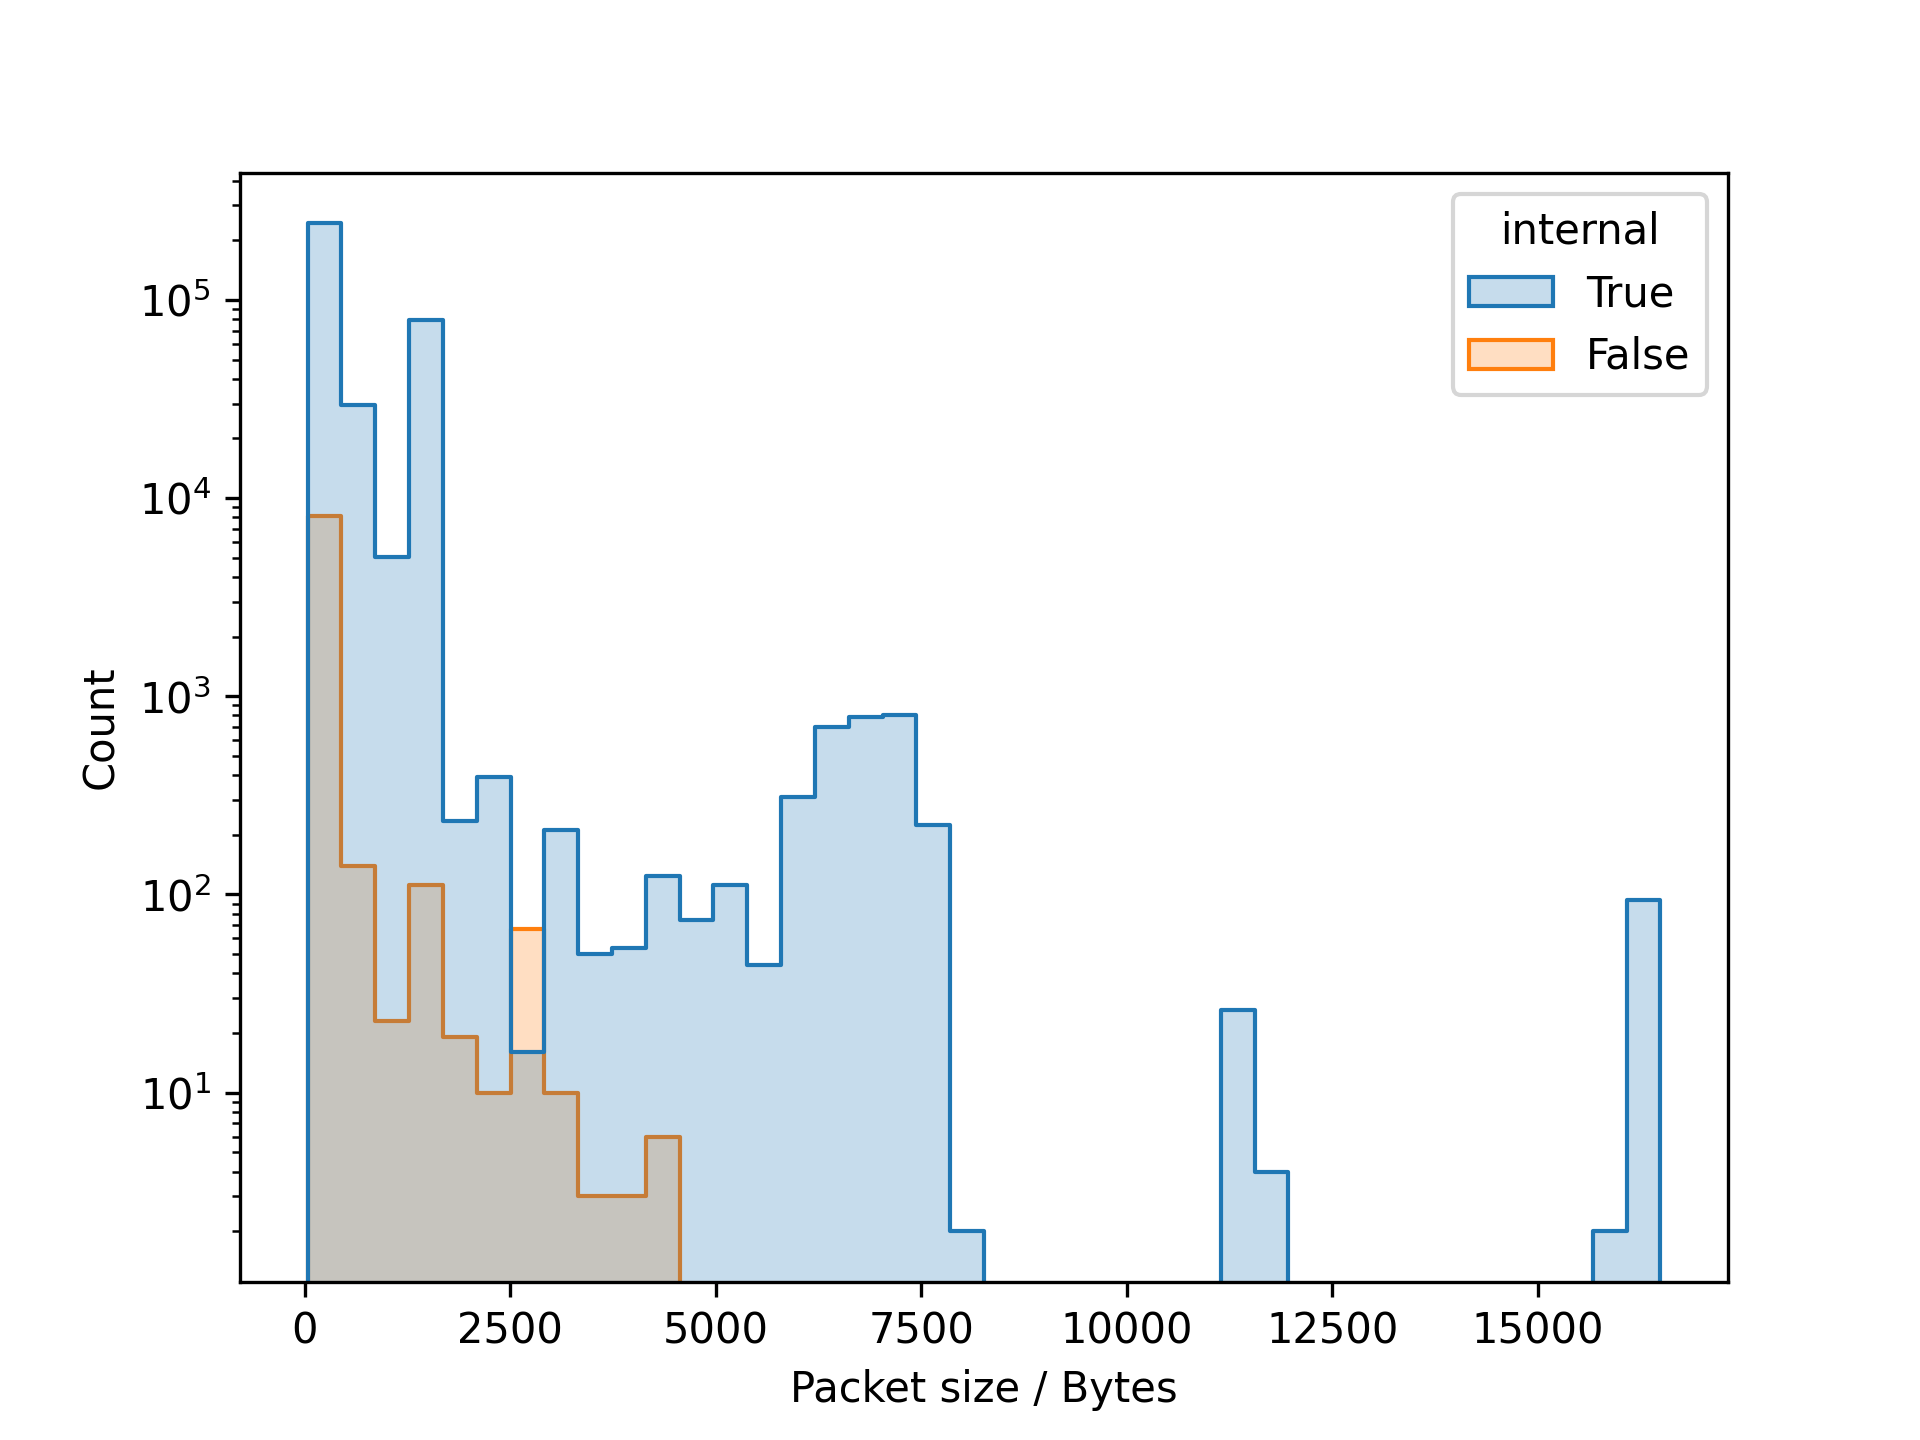
Packet length analysis
So far so good. Assume we want to investigate elevated retransmission rates. We might want to look at the distribution of packet lengths, for internal and external traffic. With the current setup, we can hand the dataframe to seaborn for visualization.
import seaborn as sns

sns.histplot(df, x="IP:len", bins=40, hue='internal', element="step")
plt.yscale("log")
plt.xlabel("Packet size / Bytes")
DNS server analysis
Next, we might want to investigate the DNS queries. Let’s look at the frequency of query names. Since we captured traffic on all interfaces, we want to filter out queries for internal servers. That’s easily done with Polars. Furthermore, since we don’t specify the direction of the query, incoming or outgoing, we capture both: incoming DNS queries to the authoritative server where tcpdump was running, as well as, name lookups originating from the server.
dns_stats = (
    df
    .explode("DNS:qnames")["DNS:qnames"]
    .drop_nulls()
    .value_counts()
    .filter(
        pl.col("DNS:qnames").str.ends_with("in-addr.arpa.").not_() &
        pl.col("DNS:qnames").str.ends_with("local.").not_()
    )
)
dns_stats.sort("count", descending=True)
| DNS:qnames | count |
|---|---|
| “gitlab.sauerburger.com.” | 91 |
| (redacted) | 55 |
| “ns-1.sit-servers.net.” | 30 |
| “ns-2.sit-servers.net.” | 30 |
| “frank.sauerburger.io.” | 12 |
| “fjell.ai.” | 8 |
| “neodns.io.” | 8 |
| “sauerburger.io.” | 8 |
| “debugci.dev.” | 6 |
| “www.fjellai.cloud.” | 6 |
| “sAUeRbuRgEr.DeV.” | 6 |
| “ds.sit-servers.net.” | 6 |
| “nEodns.teCH.” | 6 |
| “Ns-1.sIT-servErs.neT.” | 6 |
| “NS-2.SiT-SErVerS.NeT.” | 6 |
| “ns-2.sit-SeRveRS.nET.” | 6 |
| “.uhepp.org.” | 6 |
| “net.stratus.sit-servers.net.” | 6 |
| “NS-1.sIT-SERVErs.NEt.” | 2 |
| “neODNS.TecH.” | 2 |
| “nS-1.siT-SerVERS.NEt.” | 2 |
If you’re wondering why some of the DNS entries have random captialization, that’s just Google focussing on its core business.
This might also interest you