
This article shows how to do image processing in Python in just a few lines. During a vacation in Venice a couple of years ago, I took several photos of the Piazza San Marco from the same vantage point without moving the camera. Although it was very early in the morning, a few people were already on the Piazza and an even larger number of pigeons. Wouldn’t it be nice to have a picture without other people (and maybe even without pigeons)?
One way to achieve this is with long-term exposure images and ND filters. This is rather straightforward, and you have the final image directly recorded by the camera. However, this will usually not eliminate all traces of people in the scene. Often, people are still visible as blurry smears. Since I have taken several photos from the same point, I can use a different technique. This article explains how to build a median stack in Python and compute the median (as opposed to the average) along the stack axis. All you need is Python and a couple of open-source libraries. No need for expensive photo-editing software.
Let’s get started. First, we load the Pillow (PIL fork) library and numpy. I have prepared seven images of the Piazza San Marco for this example. We load all JPEG files into memory. The Pillow library provides numerous methods to manipulate images. For this example, we will decode the images into numpy arrays and save the result array as an image file again.
from PIL import Image
import numpy as np

# e.g. https://frank.sauerburger.io/assets/piazza_1.jpg
images = [
    "piazza_1.jpg",
    "piazza_2.jpg",
    "piazza_3.jpg",
    "piazza_4.jpg",
    "piazza_5.jpg",
    "piazza_6.jpg",
    "piazza_7.jpg",
]

images = [Image.open(path) for path in images]
all = np.stack(images)
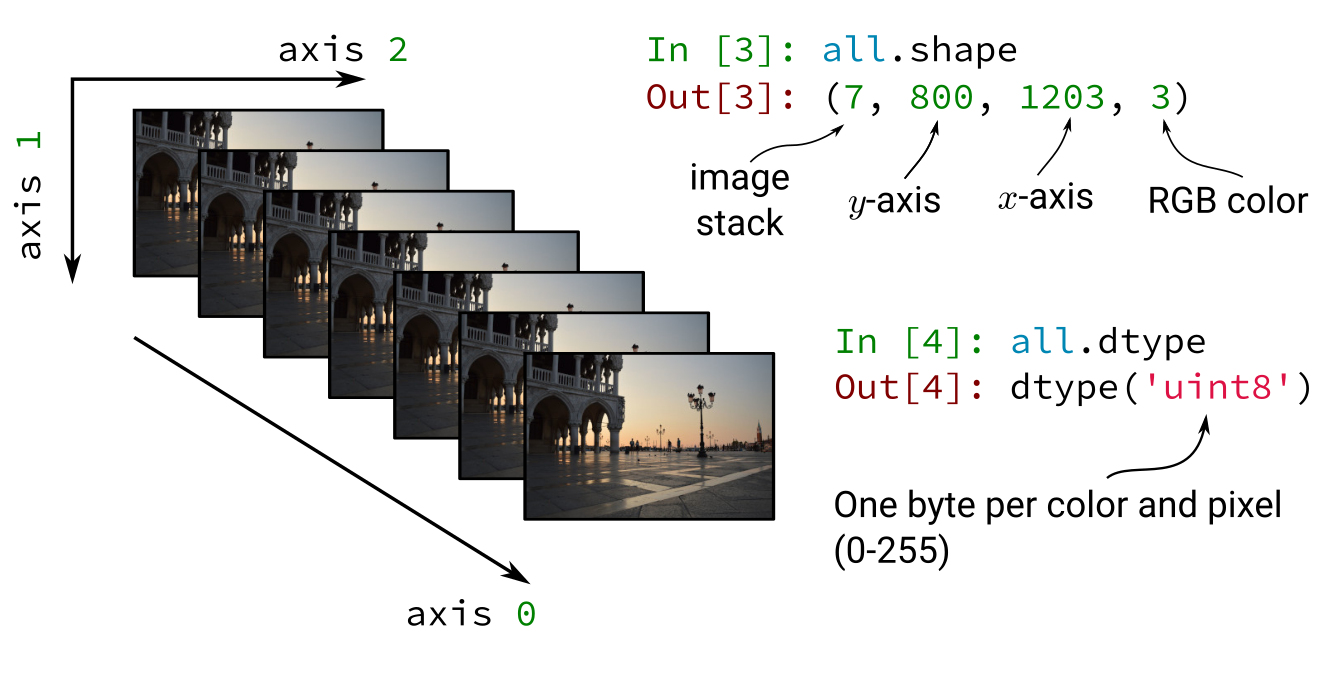
How do the image arrays look like? What’s the layout of the stack all? It is
instructive to poke around with numpy’s shape and dtype attributes. The first
axis, axis 0, refers to the individual images in the stack. The next two axes of the
array denote the \(y\) and \(x\) respectively. The images in this example are
1203 pixels wide and 800 pixels high. The final axes, axis 3, refers to the
individual colors of each pixel. We have three bytes for
each pixel: one unsigned byte for red, green, and blue.
The trick with the median stack is that we compute the median for each pixel (and actually also for each color) across axis 0 with the seven images. Why is the median interesting? Let’s look at the following example. In the last three images, you can see that a couple walked into the frame.
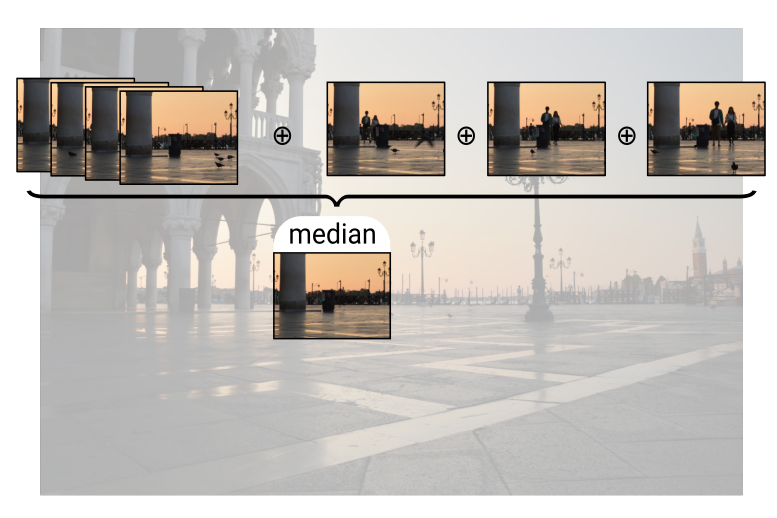
For each pixel, we assume that we have the color values from the Piazza itself and not any person in most of the images. If someone happen to walk into the frame, this ought to affect only a few images in the stack. Since the people move, a different set of images is affected for each pixel. If we take the average for each pixel across the stack, the few images with people will pull the average slightly away from the value of the Piazza. This results in blurry smears, similar to the effect of long exposure images. For the median, on the other hand, if outliers (images with people) affect only a few images, the median does not change. This means if we have enough images with the raw Piazza pixel values, we can recover the Piazza by applying the median.
Numpy provides a method to compute the median. We want to compute the median
only across axis 0 and obtain an independent median for each pixel and color.
This can be achieved with the axis=0 argument.
The final step, is to save the image and check if it worked.
composed = np.median(all, axis=0).astype(dtype='uint8')
out = Image.fromarray(composed)
out.save("piazza_median.jpg")
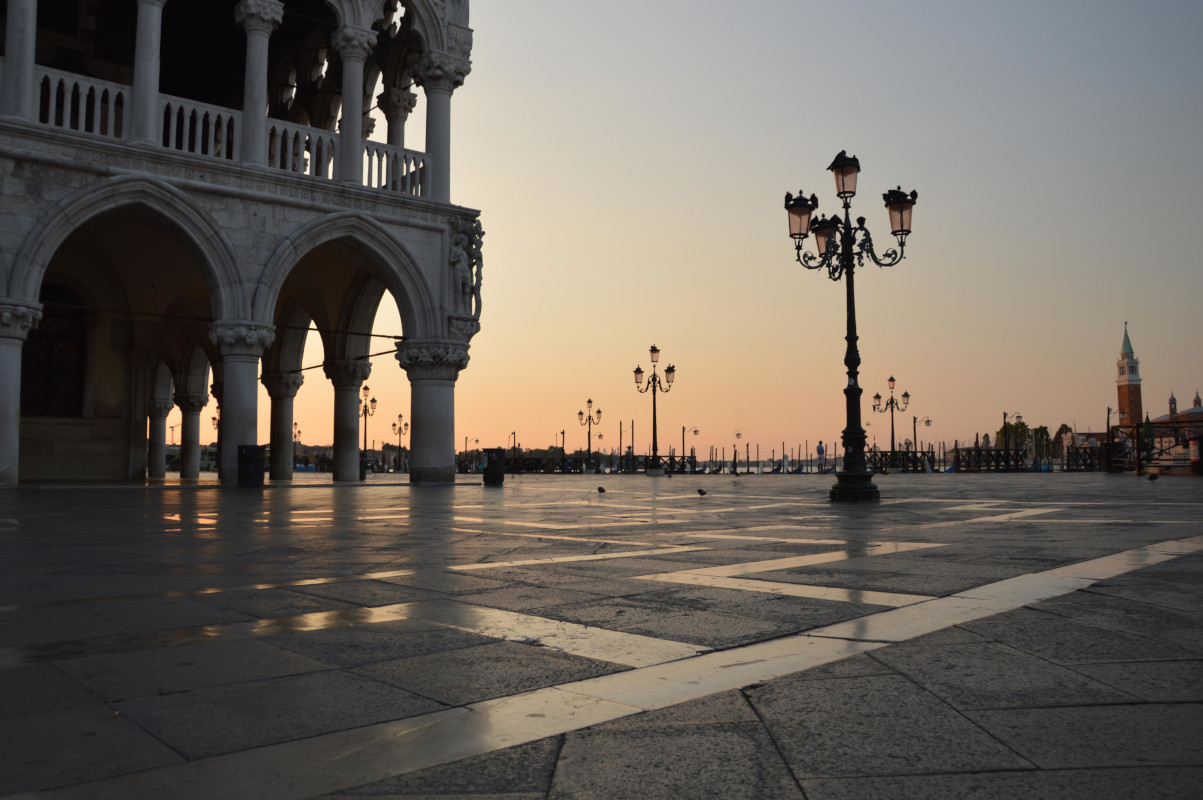
Perfect. There is no trace of anybody who happened to cross the Piazza that morning. Two pigeons did not move at all and are still visible in the final result. Pretty cool for just a few lines of Python.
This might also interest you