
ICE trains in Germany offer free WiFi (sometimes at least) with an “in-flight” portal iceportal.de. The portal displays information about the current trip, the next stop, the location, and the current speed. These are interesting pieces of information, especially since GPS signals are usually hard to receive in modern train cars. How about querying and recording these pieces of information programmatically?
The API endpoints are easy to figure out using the javascript debugger
integrated into your browser. Trip information is available from
TRIP_URL while the geo location is available at GEO_URL.
TRIP_URL = "https://iceportal.de/api1/rs/tripInfo/trip"
GEO_URL = "https://iceportal.de/api1/rs/status"
Simple get requests in Python produce the following output:
import requests
from pprint import pprint

response = requests.get(GEO_URL)
pprint(response.json())

# The pprint() call outputs
{'bapInstalled': True,
 'connection': True,
 'connectivity': {'currentState': 'HIGH',
                  'nextState': 'UNSTABLE',
                  'remainingTimeSeconds': 600},
 'date': '2022-12-02T09:18:25.897815',
 'gpsStatus': 'VALID',
 'internet': 'HIGH',
 'latitude': 47.806151,
 'longitude': 7.597108333333333,
 'series': '412',
 'serverTime': 1669965505913,
 'serviceLevel': 'AVAILABLE_SERVICE',
 'speed': 118.0,
 'tileX': -144,
 'tileY': -244,
 'trainType': 'ICE',
 'tzn': 'ICE9021',
 'wagonClass': 'SECOND'}
From this endpoint we can get the values we could normally obtain from a GPS receiver: latitude, longitude, and speed. With a few more lines of python we can poll the endpoint, record the responses and display the speed profile of the trip. For example, to display the route, run
import pandas as pd
import seaborn as sns

df = pd.read_json("geo.ndjson", lines=True)
df = df[df.gpsStatus == "VALID"]
sns.scatterplot(data=df, y='latitude', x='longitude', hue='speed', edgecolor=None)
plt.savefig("db_geo.pdf")
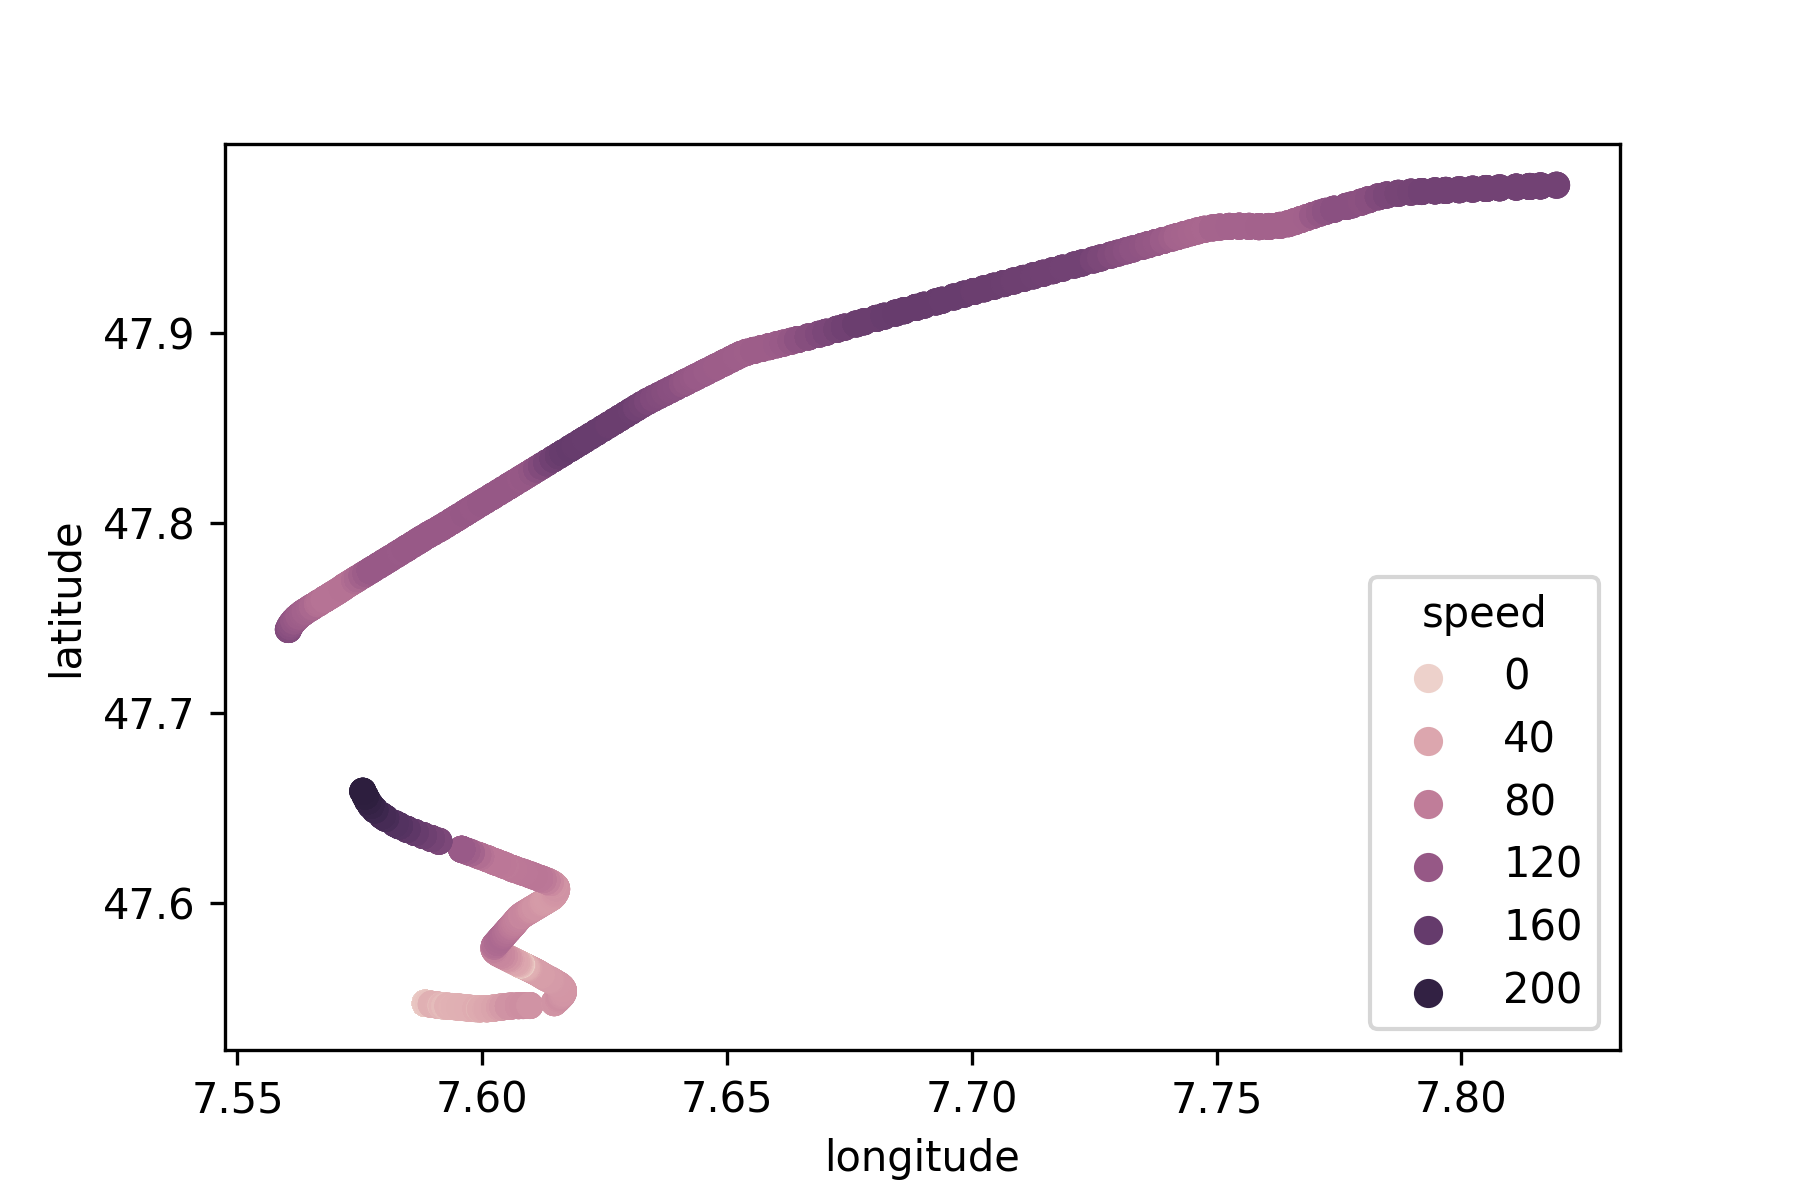
The large gap between the points corresponds to a tunnel.
This might also interest you